Feature
PowerPoint reports: editable, deliverable presentations
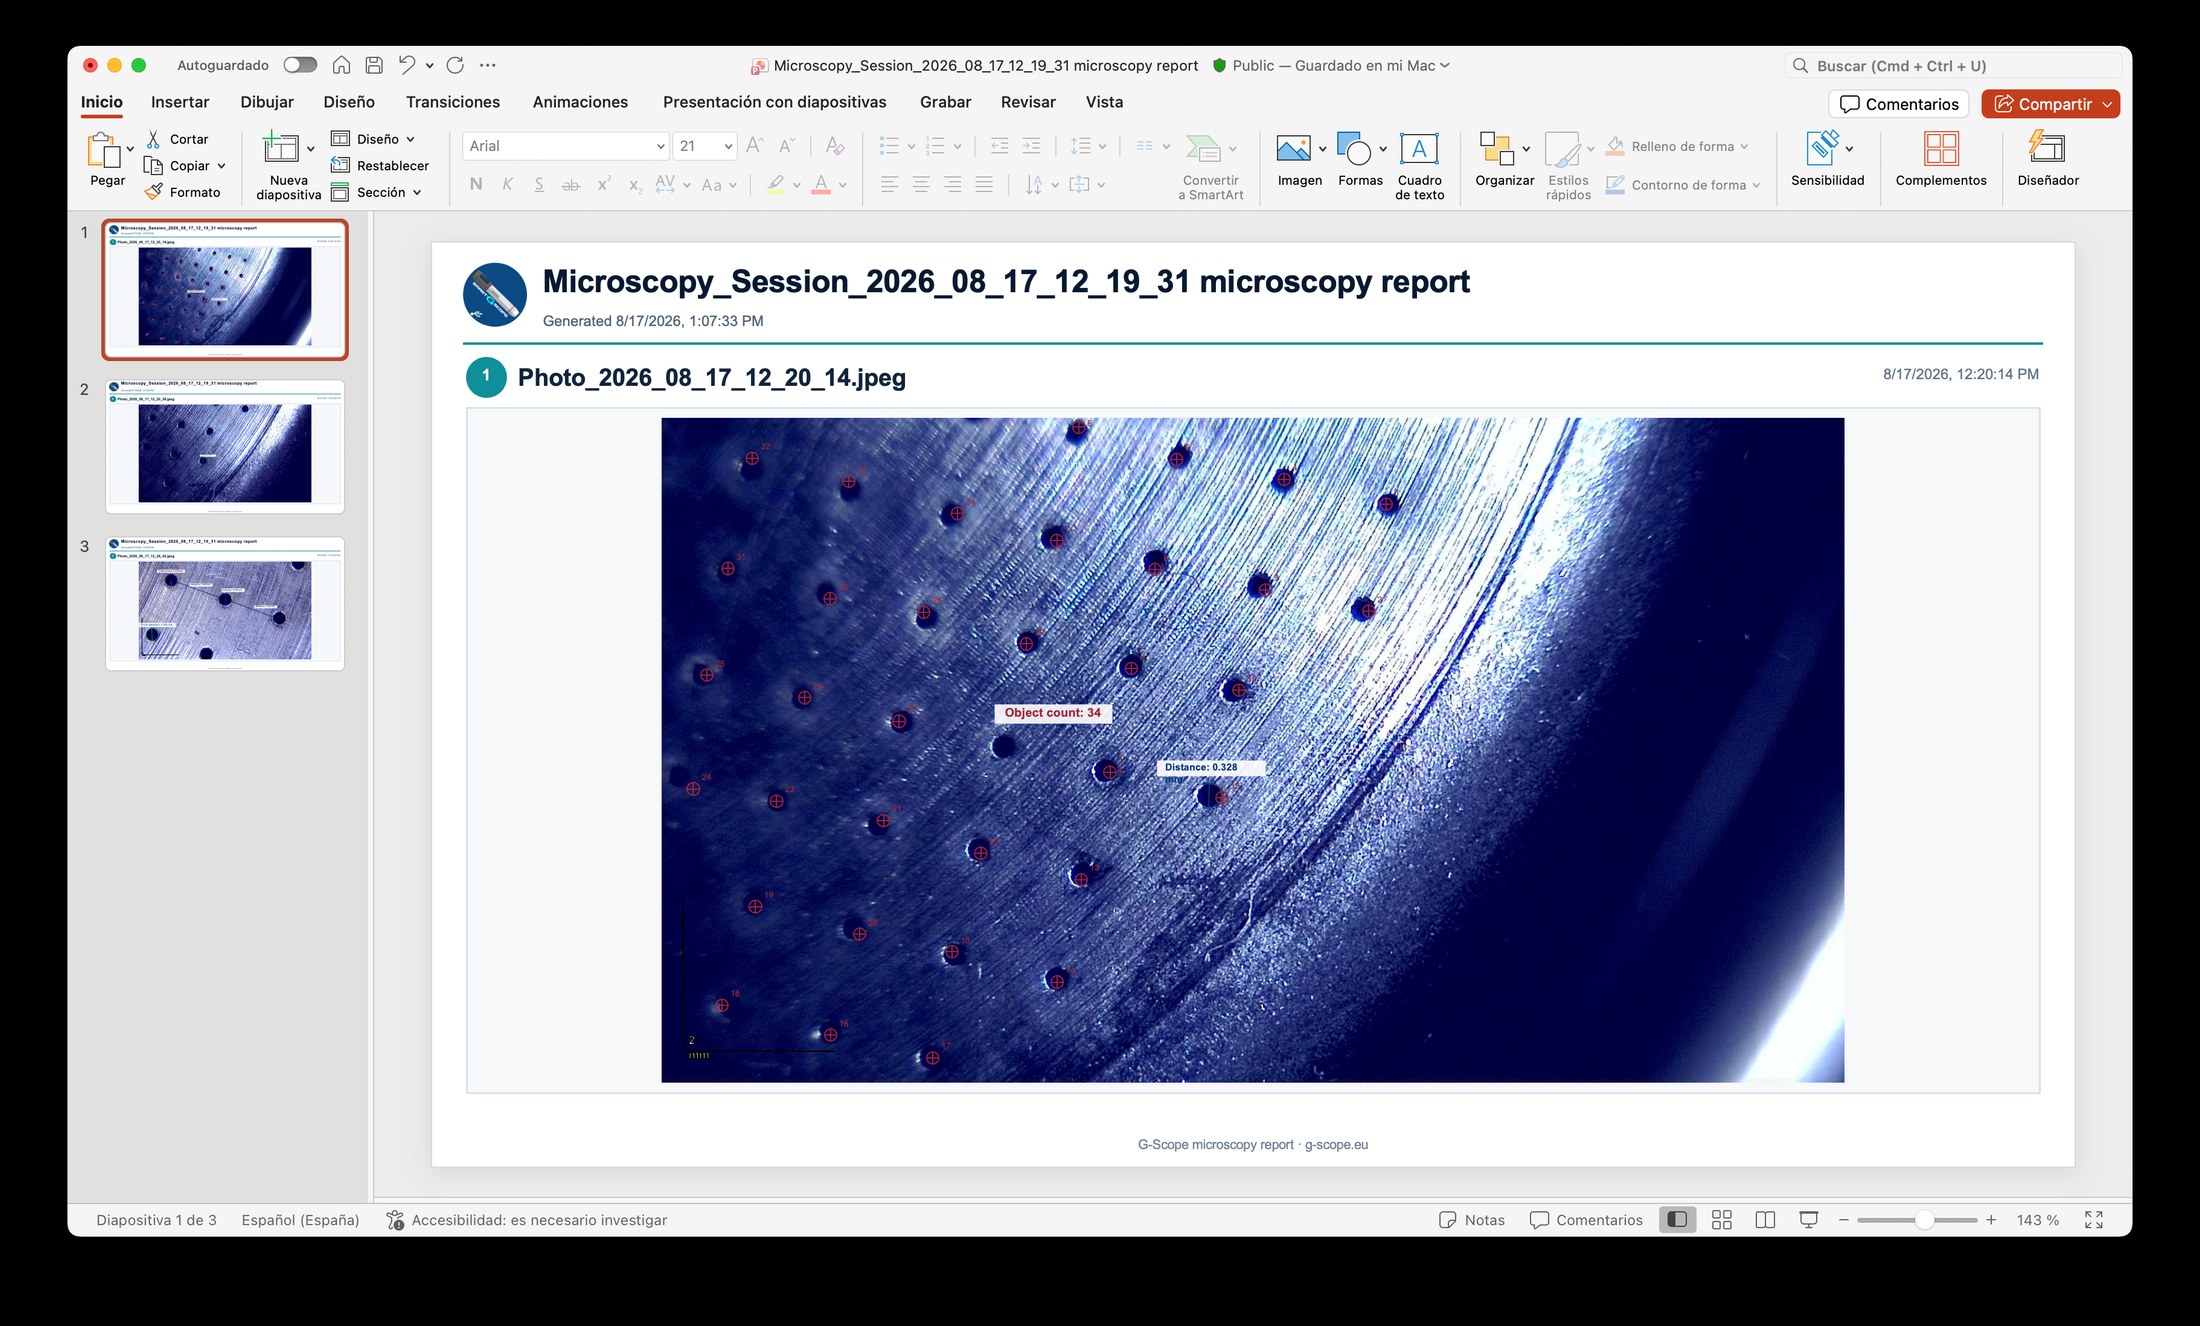
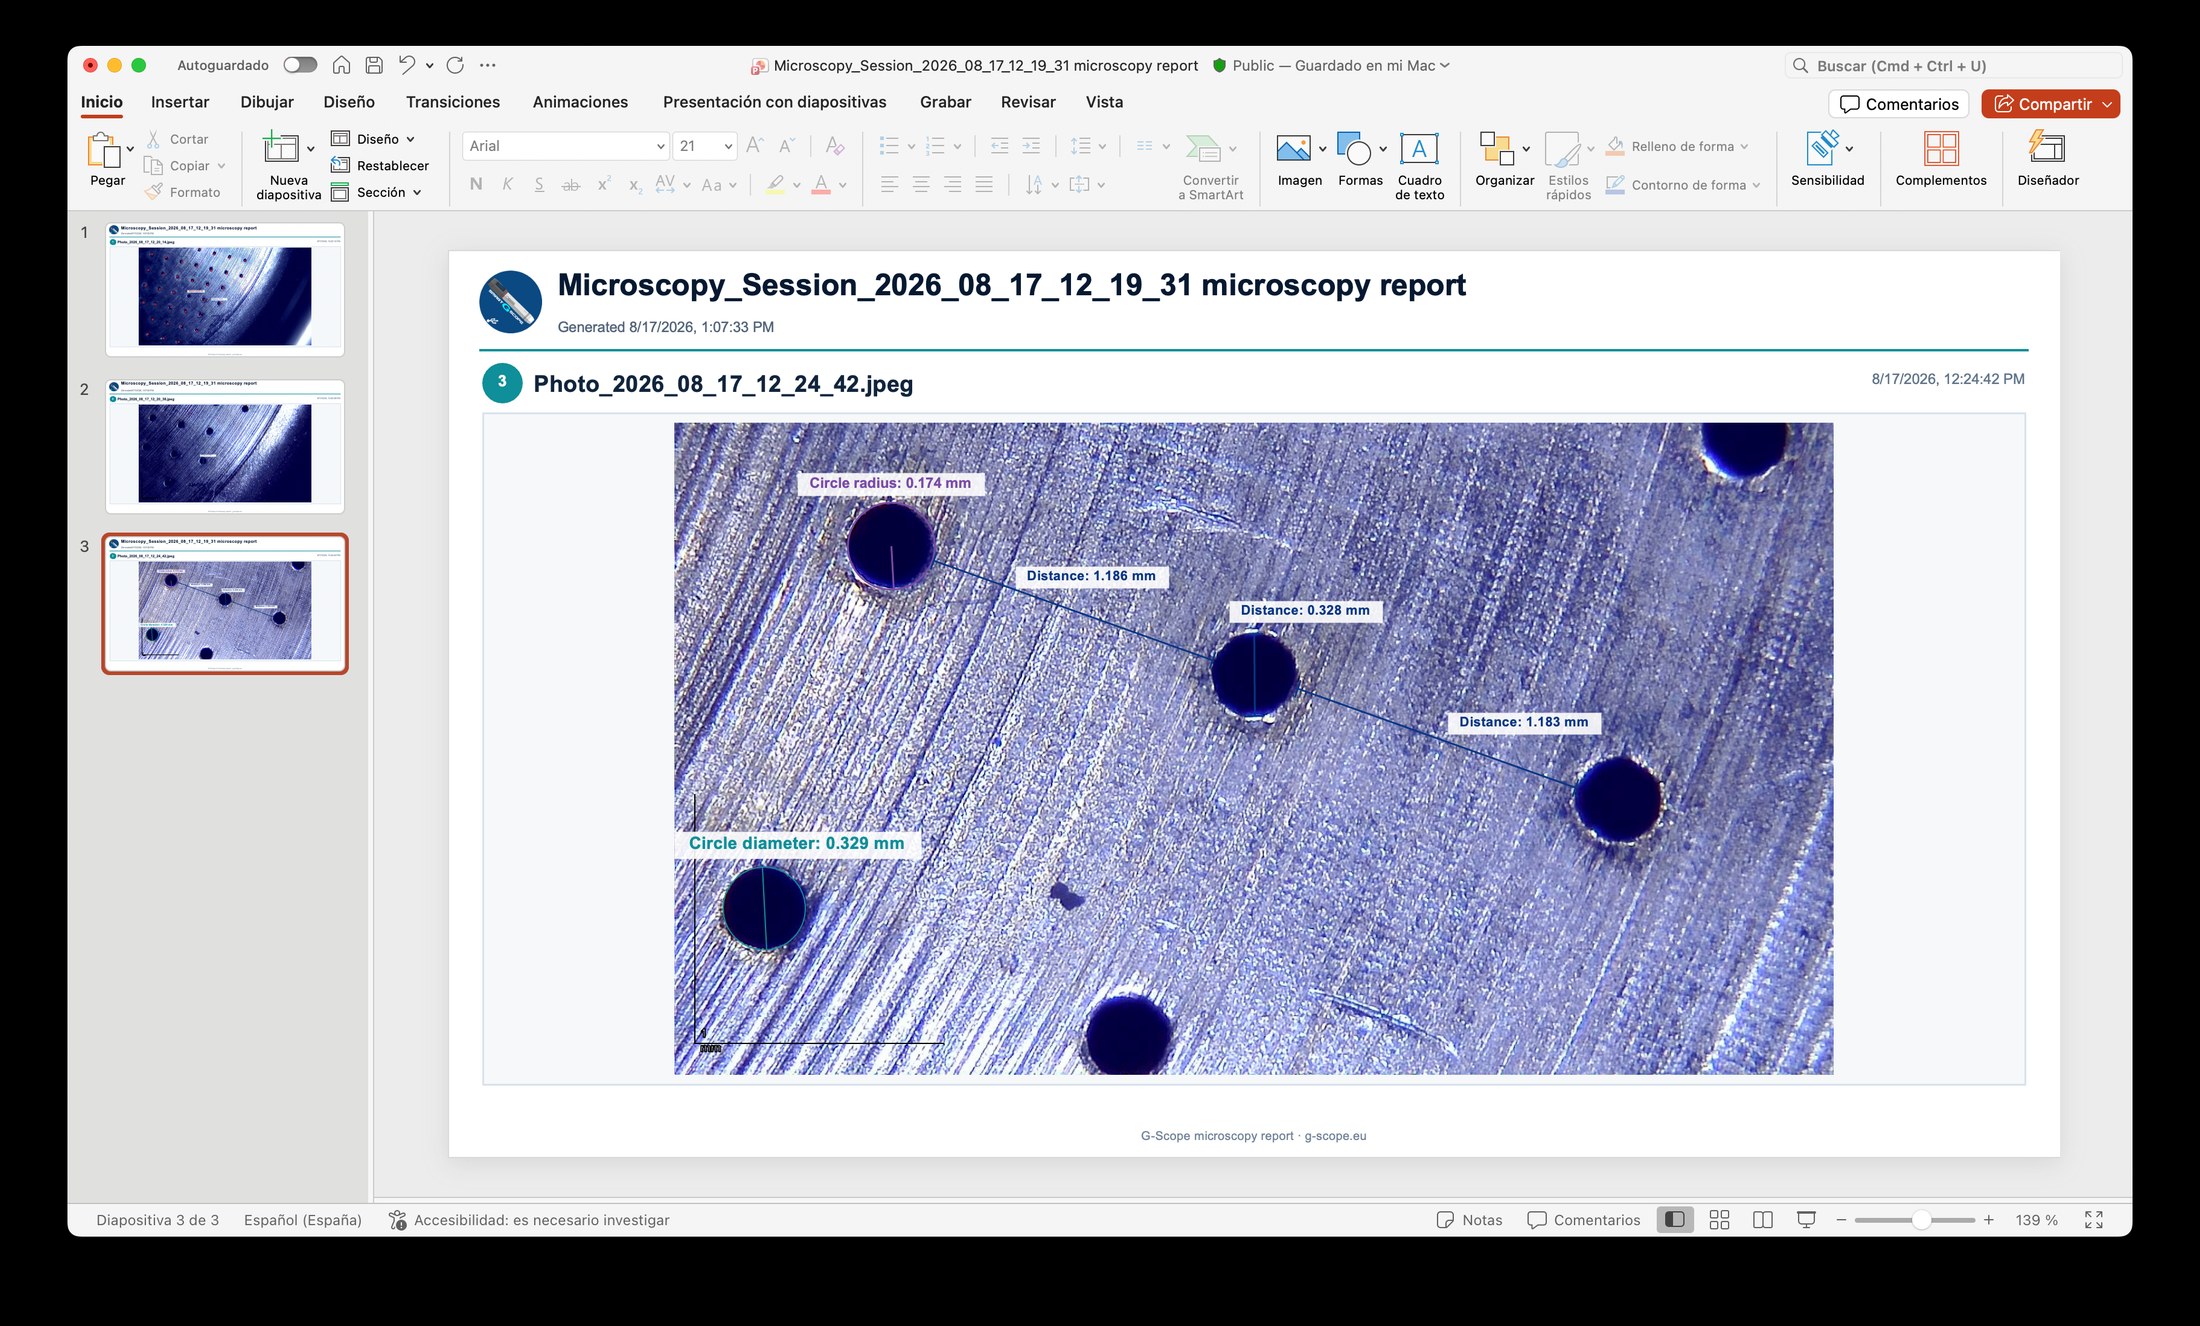
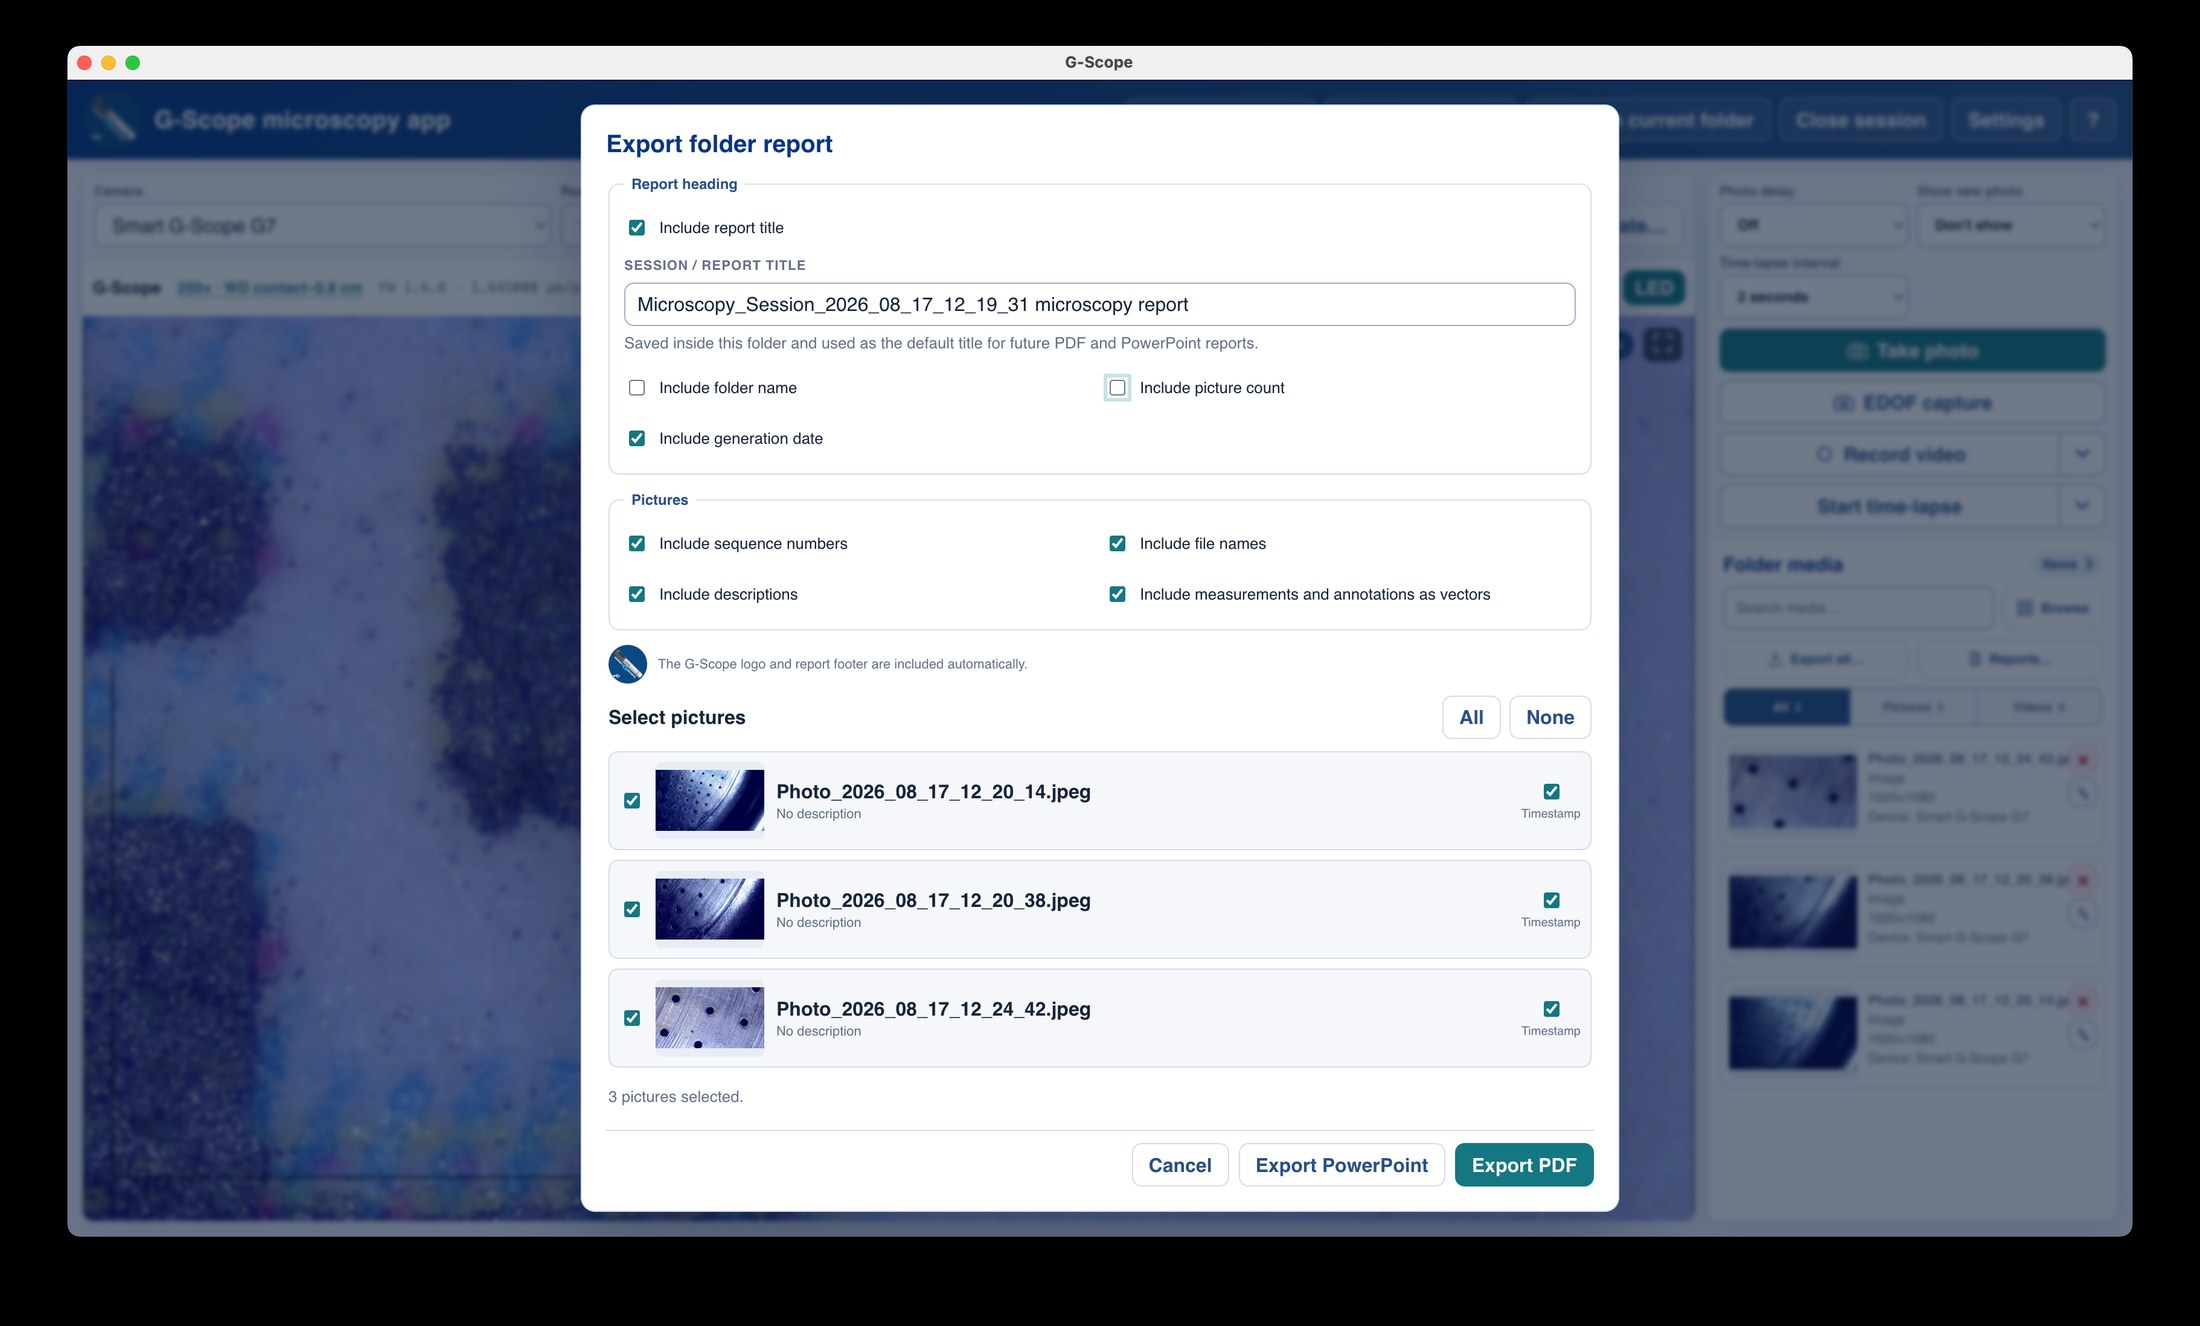
The PowerPoint report generates a native .pptx, each picture on its own slide, with measurements and annotations as editable vector shapes. Perfect for review cycles, teaching and client deliverables.
At a glance
Native .pptx
Opens in PowerPoint, Keynote and Google Slides
Editable objects
Shapes, labels and arrows stay vector and editable
Per-picture slides
One slide per session picture, with metadata
Local
Generated on your computer
What you get
Editable, not flattened
Unlike a screenshot dump, each measurement and annotation is a real shape in the file. Reviewers can adjust, annotate and reuse the content.
One slide per picture
The whole session becomes a structured deck, natural for lab meetings, client reviews and classroom work.
Calibrated overlays carried over
The same measurement and annotation data rendered into the PDF report is available as editable shapes in the PowerPoint export.
No cloud involved
The .pptx is generated locally. Nothing leaves your computer.
Deliverables: manual vs G-Scope Desktop
| ✕Paste screenshots into PowerPoint, losing editability and metadata | Native .pptx with editable measurement shapes and metadata per slide |
| ✕Spend an hour rebuilding the deck for every review | Re-export the folder in one click |
| ✕No trace of calibration or capture settings in the deck | Metadata travels with each slide |
Screenshots & video
Frequently asked questions
Is the PowerPoint export free?
PowerPoint folder reports are a Pro feature (same as PDF reports). The dialog opens freely; the export requires a Pro license or a connected genuine Smart G-Scope.
Which programs can open the file?
The export is a standard .pptx, so Microsoft PowerPoint, Keynote, LibreOffice Impress and Google Slides all open it.
Can I edit the measurements in PowerPoint?
Yes: measurements and annotations are exported as editable vector shapes, not flattened pixels.